Crypto dashboards
Interactive dashboards on the crypto market and its ecosystems: market mood, where the money is, the main apps and how they connect.
Market dashboards
The crypto market as a whole: every hack since 2011, the Fed and Bitcoin, where money is rotating, market mood, stablecoins, token unlocks, upcoming tokens and past cycle peaks.
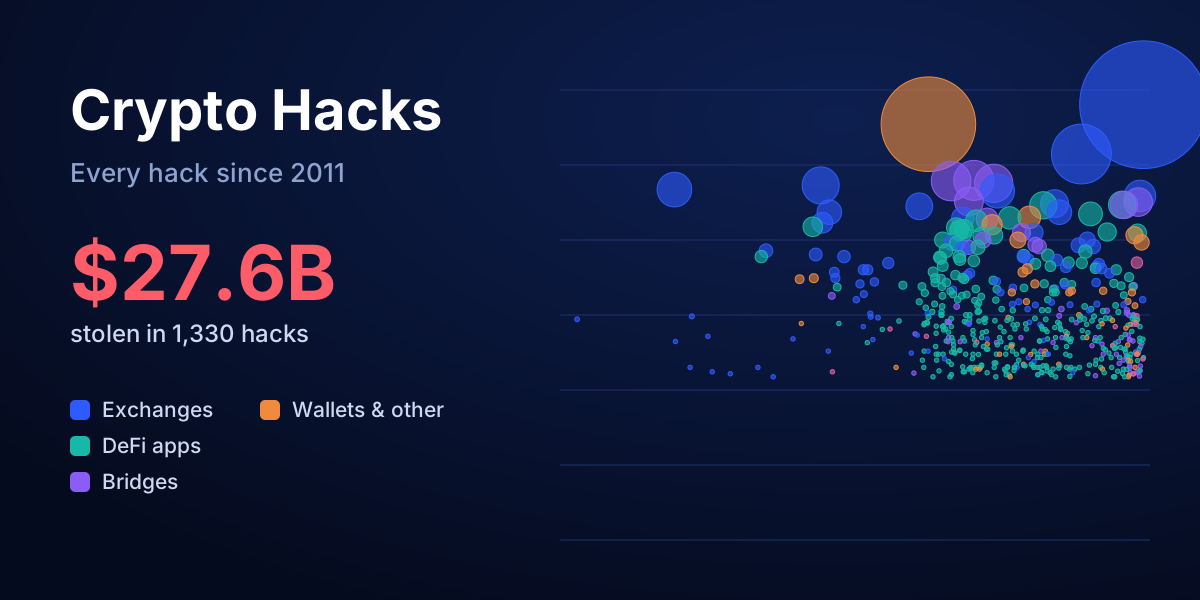
Crypto Hacks
Every crypto hack and exploit since Mt. Gox in 2011: money stolen year by year, all hacks on one timeline, how attackers got in, which blockchains were hit, North Korea’s share and a searchable list.
Open dashboard →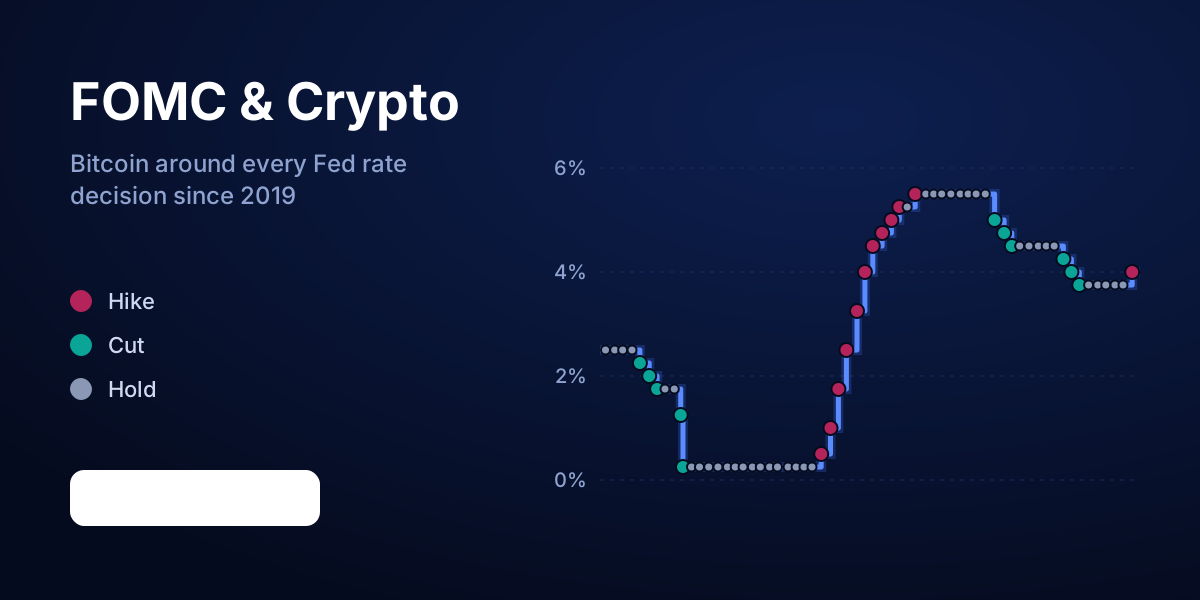
FOMC & Crypto
What Bitcoin did around every Fed rate decision since 2019: a countdown to the next one, the Fed rate next to the Bitcoin price, the typical path around a meeting, and each decision hour by hour.
Open dashboard →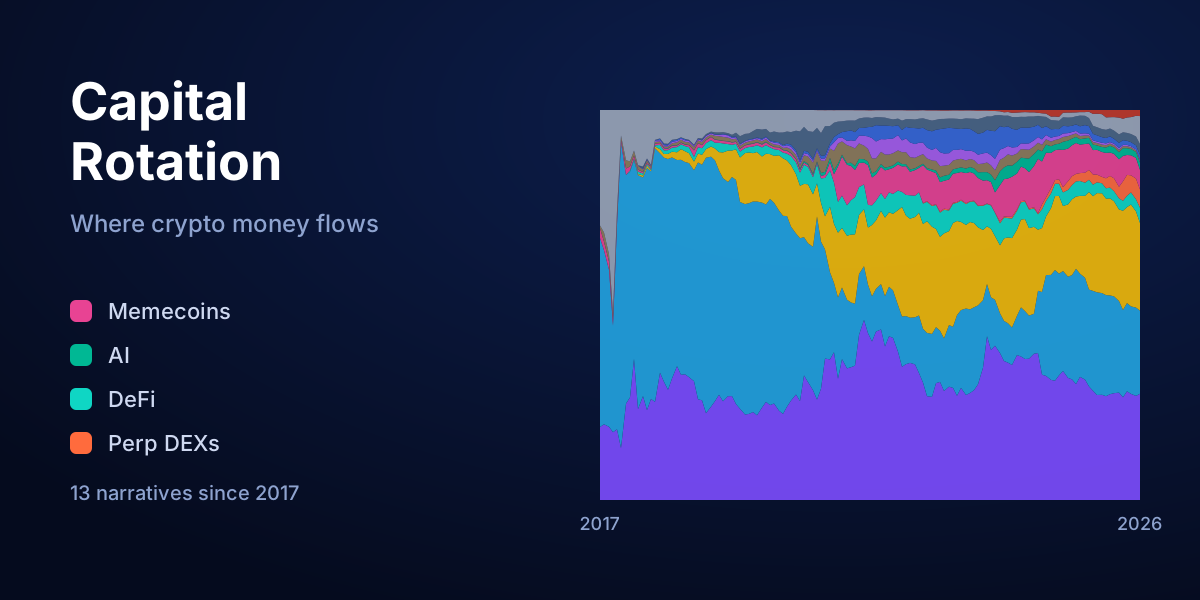
Capital Rotation: where crypto money flows
The market cap of 13 narratives — AI, memecoins, DeFi, Layer 1s, perp DEXs, RWA and more — week by week since 2017: which one is attracting money now, a heatmap of every quarter, and when each bubble burst.
Open dashboard →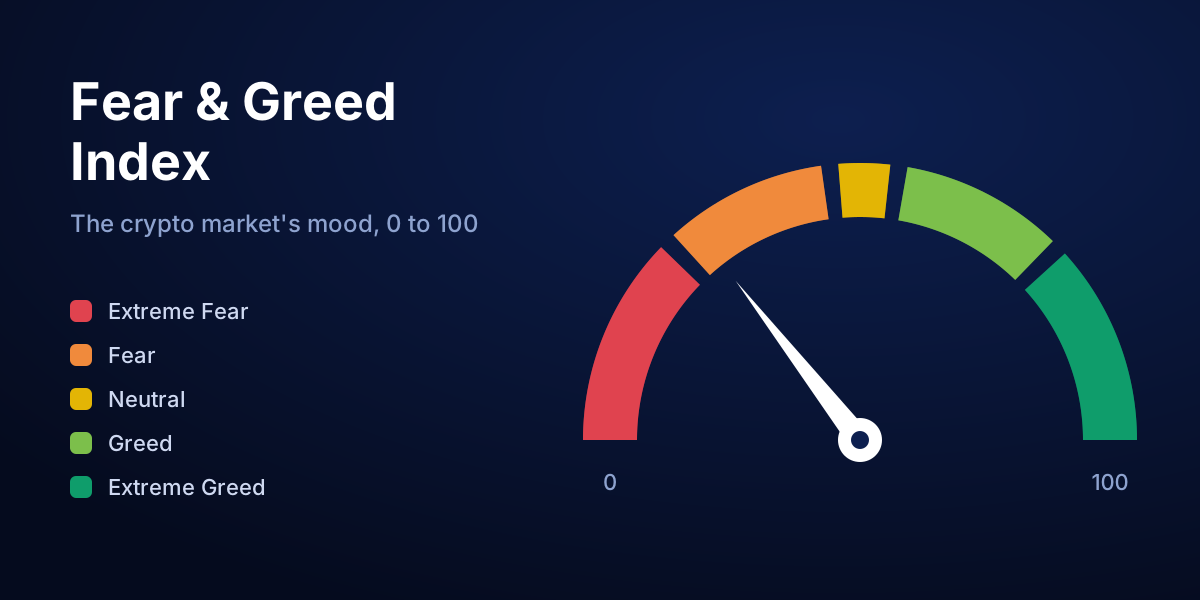
Crypto Fear & Greed Index
Today’s market mood from 0 (extreme fear) to 100 (extreme greed), its history since 2018 next to the Bitcoin price, and what Bitcoin did after fearful and greedy days.
Open dashboard →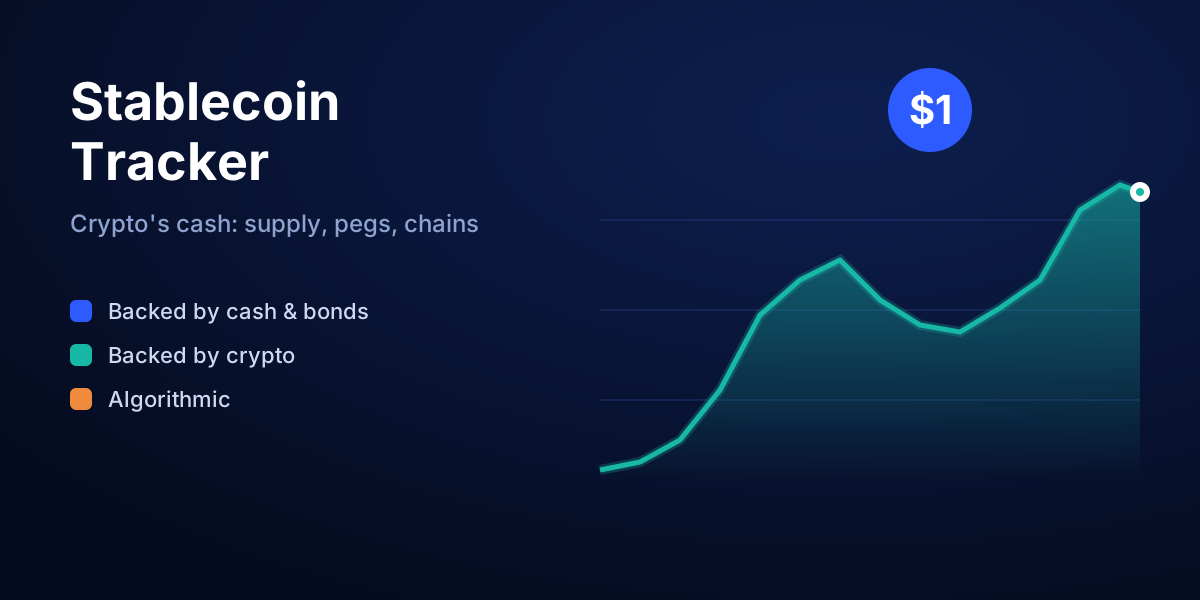
Stablecoin Tracker
The cash of the crypto market: total stablecoin supply and how it is changing, its history since 2020 next to the Bitcoin price, the 20 biggest stablecoins with an off-peg warning, and which blockchains hold them.
Open dashboard →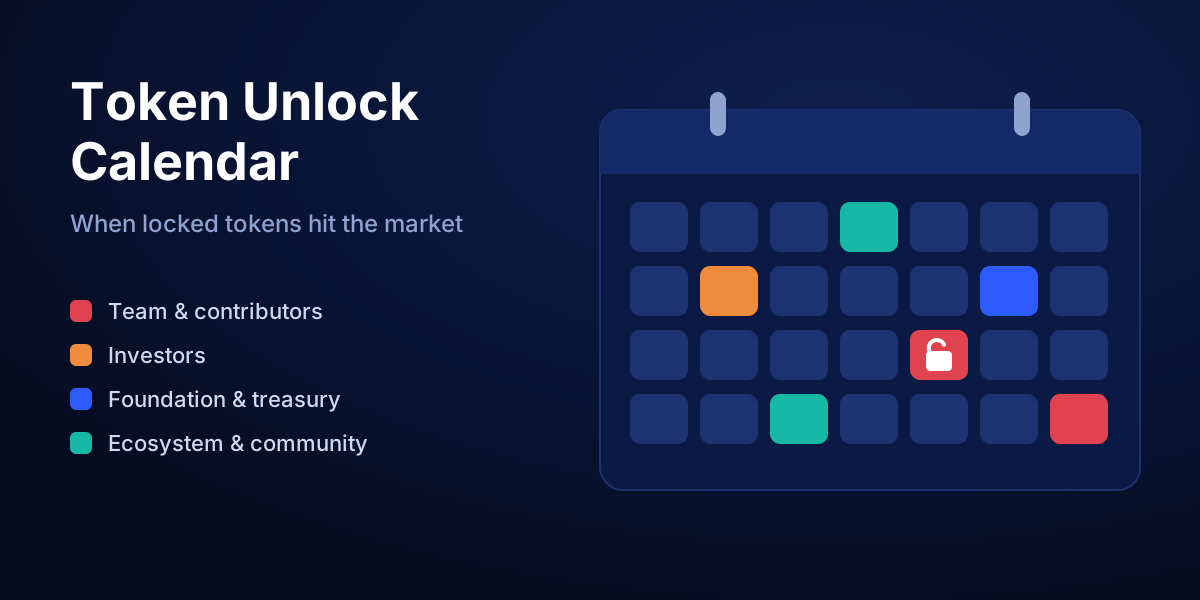
Token Unlock Calendar
When the locked team, investor and treasury tokens of 30 major coins are released: a 60-day calendar, the biggest unlocks next to each coin’s circulating supply, and the next 12 months by who receives the tokens.
Open dashboard →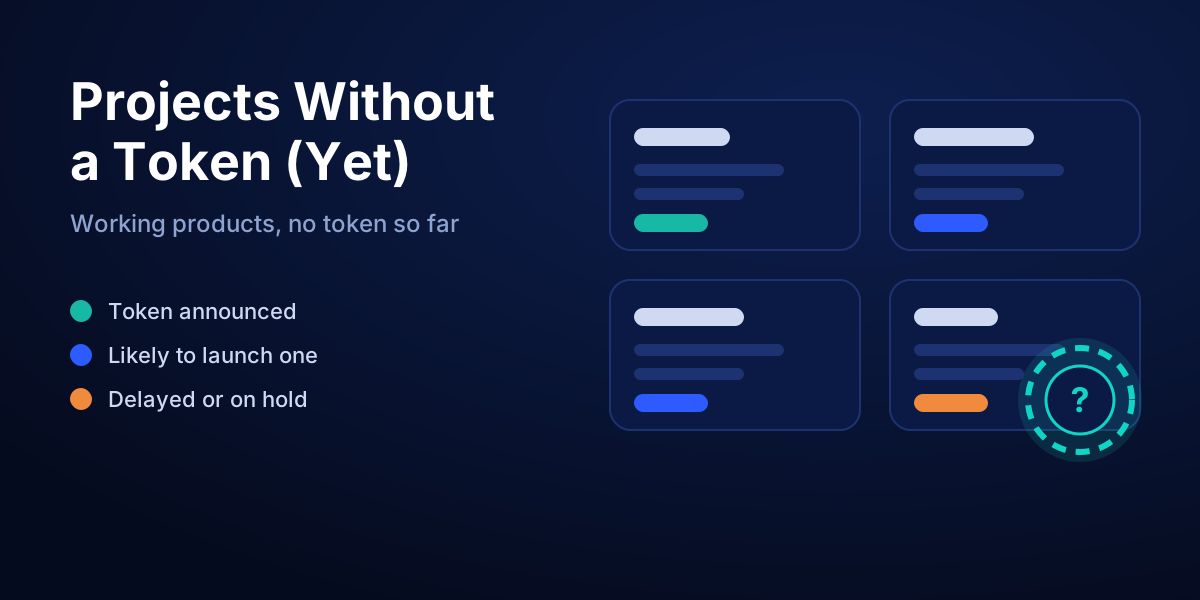
Projects Without a Token (Yet)
Crypto apps and networks that already work but have no token: the ones that announced one, the ones likely to, their points programs and backers, and the projects that launched this year.
Open dashboard →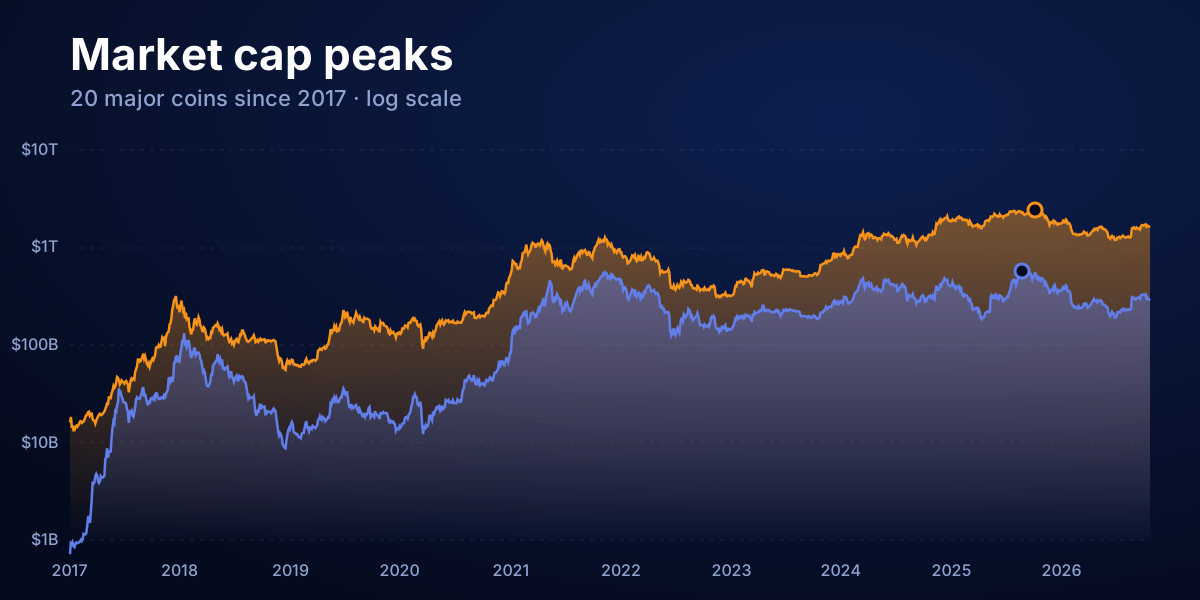
Crypto market cap peaks since 2017
Market caps of Bitcoin, Ethereum and 18 other major coins day by day since 2017, with every cycle peak marked. Tick the coins you want to compare and hover to see any day.
Open dashboard →Ecosystem dashboards
One dashboard per blockchain: the chain as a 3D space station with its biggest apps as satellites, plus where the money is, the main protocols, the token and key events.
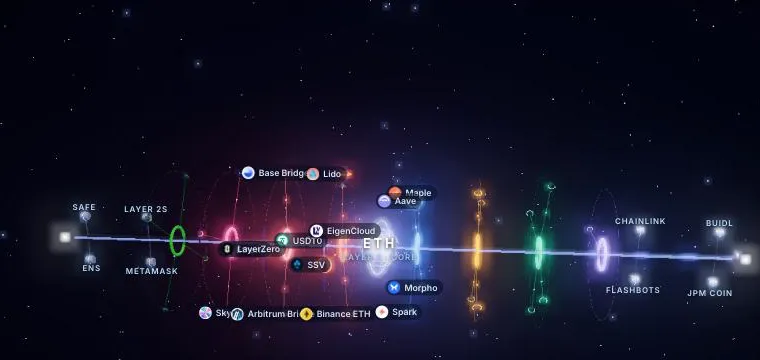
Ethereum
$44.06B in DeFi
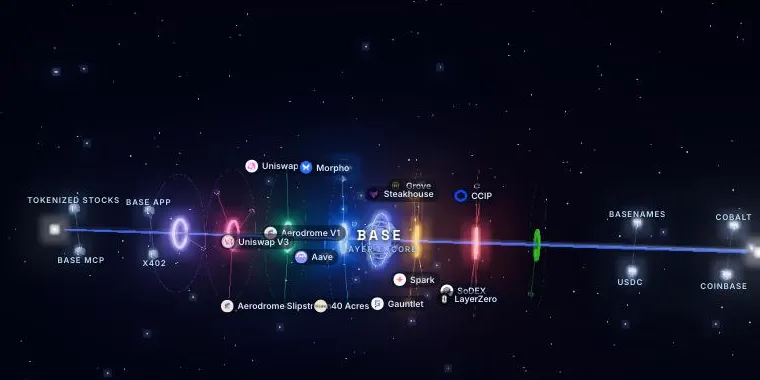
Base
$5.86B in DeFi
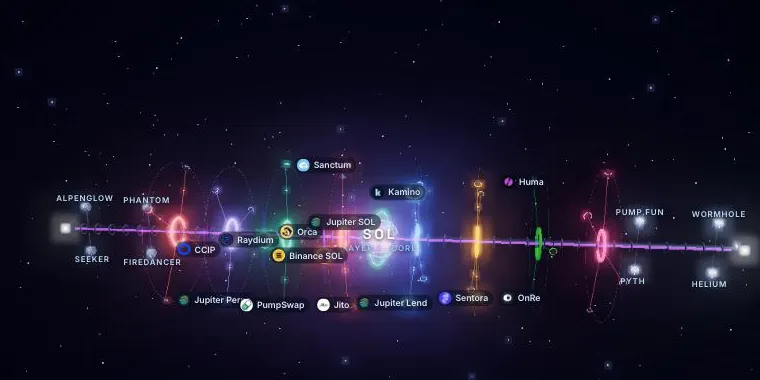
Solana
$5.45B in DeFi
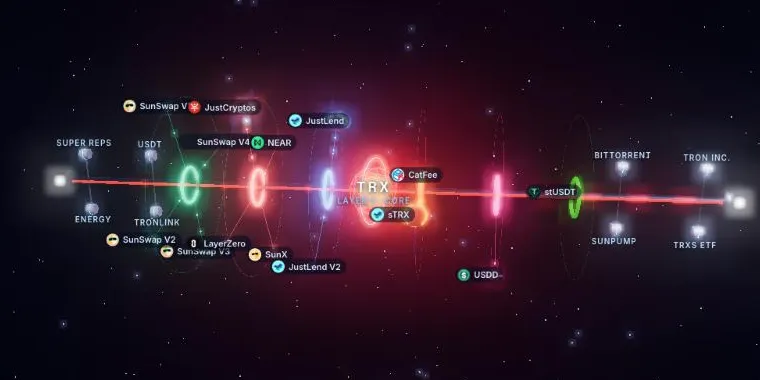
Tron
$5.38B in DeFi
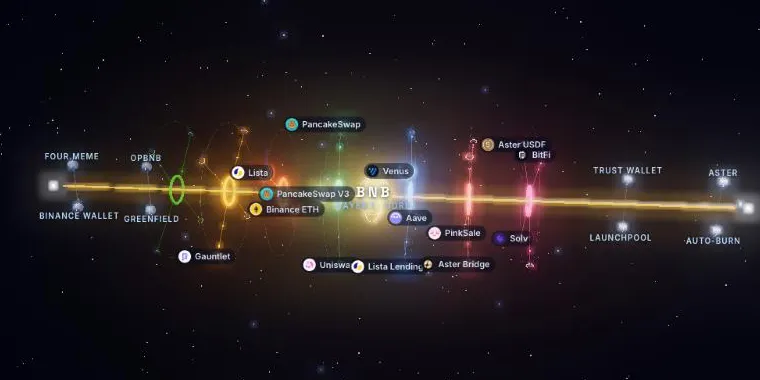
BNB Chain
$5.24B in DeFi

Hyperliquid
$2.61B in DeFi

Arbitrum
$1.44B in DeFi
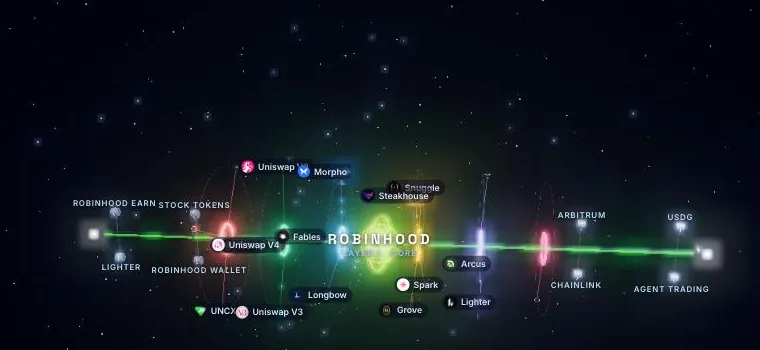
Robinhood Chain
$1.09B in DeFi
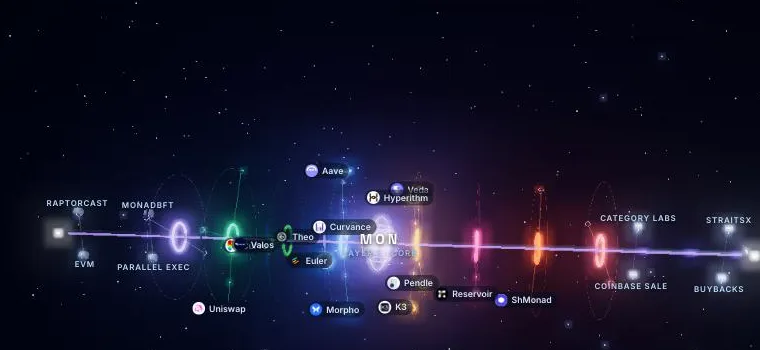
Monad
$890.2M in DeFi
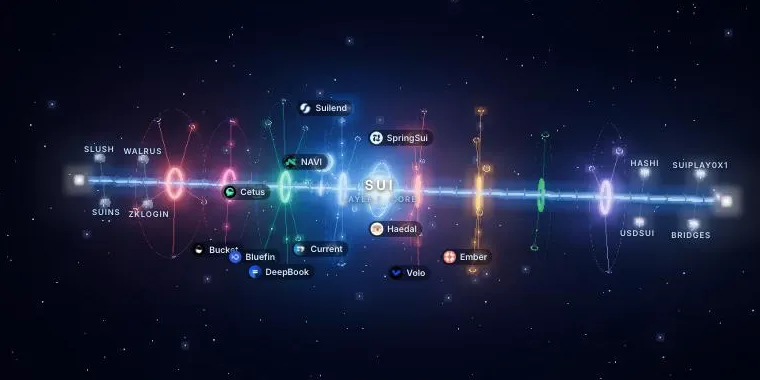
Sui
$463.4M in DeFi